


Home > Block Profile
Block Profile
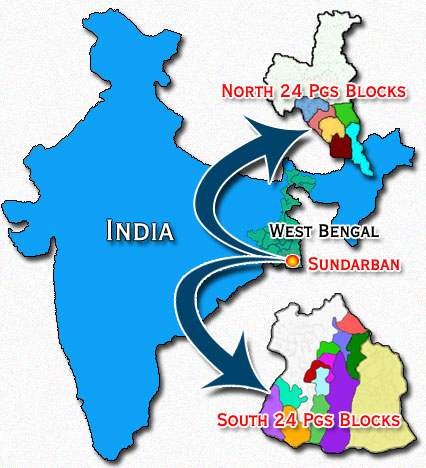
The operation area of Sundarban Affairs Department is spread over 16 Police Stations and 19 Panchayat Samities of South & North 24-Parganas district. The administrative set up of Sundarban Area.
| District | Sub-Division | Police Stations | Blocks / Panchayat Samitee |
|---|---|---|---|
| 24-Parganas (South) | Kakdwip | Sagar, Namkhana, Kakdwip,Patharpratima | Sagar, Namkhana, Kakdwip,Patharpratima |
| Diamond Harbour | Mathurapur, Roydighi | Mathurapur-I, Mathurapur-II | |
| Baruipur | Kultali, Joynagar | Kultali, Joynagar-I, Joynagar-II | |
| Canning | Canning, Basanti, Gosaba | Canning-I, Canning-II, Basanti, Gosaba | |
| 24-Parganas (North) | Bashirhat | Hingalganj, Hasnabad, Sandeshkhali, Haroa, Minakhan | Hingalganj, Hasnabad, Sandeshkhali-I, Sandeshkhali-II, Haroa, Minakhan. |
The Block Profile of Sundarbans showing the demographic features, land use Pattern, irrigation status, agricultural production, academic institutions, medical facilities, financial institutions, fisheries and live stocks, physical infrastructures available etc. will give indication of wide varieties.
| Sl. No. | Blocks | HH | TP | TM | TF | TSC | TST | TLT | MLT | FLT | TW | CULT | AL |
|---|---|---|---|---|---|---|---|---|---|---|---|---|---|
| 1 | HAROA | 46888 | 214401 | 111080 | 103321 | 50636 | 12728 | 136679 | 75747 | 60932 | 73257 | 57856 | 19503 |
| 2 | MINAKHAN | 43756 | 199084 | 101827 | 97257 | 60578 | 18564 | 122283 | 67728 | 54555 | 68327 | 8345 | 18028 |
| 3 | SANDESHKHALI-I | 37344 | 164465 | 83925 | 80540 | 50812 | 42674 | 100978 | 56501 | 44477 | 61005 | 7098 | 16034 |
| 4 | SANDESHKHALI-II | 37771 | 160976 | 81921 | 79055 | 72300 | 37695 | 98805 | 56205 | 42600 | 61479 | 6887 | 15034 |
| 5 | HASNABAD | 47739 | 203262 | 104019 | 99243 | 51295 | 7492 | 127403 | 69699 | 57704 | 80077 | 8540 | 17049 |
| 6 | HINGALGANJ | 46048 | 174545 | 88937 | 85608 | 115227 | 12743 | 119630 | 66858 | 52772 | 74515 | 7767 | 17577 |
| N 24-PGS | 259546 | 1116733 | 571709 | 545024 | 400848 (35.89%) |
131896 (11.81%) | 705778 (63.20%) | 392738 (68.70%) |
313040 (57.55%) | 418660 (37.49%) | 49015 | 103225 | |
| 7 | CANNING-I | 64041 | 304724 | 155126 | 149598 | 144906 | 3710 | 184241 | 103611 | 80630 | 108848 | 10586 | 13380 |
| 8 | CANNING-II | 49711 | 252523 | 128438 | 124085 | 52859 | 14910 | 139058 | 77784 | 61274 | 83899 | 8733 | 20425 |
| 9 | MATHURAPUR-I | 40602 | 195104 | 100093 | 95011 | 68636 | 496 | 123647 | 69311 | 54336 | 64219 | 4498 | 10263 |
| 10 | MATHURAPUR-II | 45888 | 220839 | 113831 | 107008 | 62342 | 4643 | 151186 | 85316 | 65870 | 80895 | 13387 | 17382 |
| 11 | JOYNAGAR-I | 55734 | 263151 | 134966 | 128185 | 102645 | 80 | 165987 | 93228 | 72759 | 89248 | 6092 | 13091 |
| 12 | JOYNAGAR-II | 50413 | 252164 | 128858 | 123306 | 85587 | 1046 | 148676 | 84612 | 64064 | 93240 | 11826 | 15802 |
| 13 | KULTALI | 45099 | 229053 | 117562 | 111491 | 104193 | 5672 | 134101 | 78601 | 55500 | 87670 | 13838 | 19102 |
| 14 | BASANTI | 70818 | 336717 | 171279 | 165438 | 119631 | 20060 | 195366 | 110229 | 85137 | 132044 | 18586 | 27453 |
| 15 | GOSABA | 58197 | 246598 | 125910 | 120688 | 154584 | 23343 | 172781 | 96642 | 76139 | 110996 | 14425 | 23194 |
| 16 | KAKDWIP | 60201 | 281963 | 144120 | 137843 | 97944 | 1836 | 192692 | 106726 | 85966 | 100663 | 10440 | 14625 |
| 17 | SAGAR | 43716 | 212037 | 109468 | 102569 | 56261 | 854 | 156476 | 87052 | 69424 | 84881 | 13785 | 14463 |
| 18 | NAMKHANA | 41433 | 182830 | 93351 | 89479 | 47260 | 741 | 138177 | 75314 | 62803 | 65889 | 11421 | 10839 |
| 19 | PATHAR PRATIMA | 69641 | 331823 | 169422 | 162401 | 76163 | 2640 | 237955 | 131063 | 106892 | 141001 | 17007 | 24312 |
| S 24-PGS | 695494 | 3309526 | 1692424 | 1617102 | 1173011 (35.44%) | 80031 (2.42%) |
2140343 (64.67%) | 1199489 (70.87%) | 940854 (58.18%) | 1243503 | 154624 | 224331 | |
| TOTAL SUNDARBANS | 955040 | 4426259 | 2264133 | 2162126 | 1573859 | 211927 | 2846121 | 1592227 | 1253894 | 1662163 | 203639 | 327556 | |
| (%) | 35.56 | 4.79 | 64.30 | 70.32 | 58.00 | 37.55 |
Demographic Information of Sundarban region as per 2011 Census
Person / household – 4.63, Person / sqkm – 996, Male: Female - 1000:955, Decadal Growth Rate – 15%, % of TW irt TP – 38, % of Cultivators irt TP – 4.6, % of Agril. Labourers irt TP – 7.4
Note: TP – Total Persons, TM- Total Male, TF – Total Female, TSC – Total Scheduled Castes, TST – Total Scheduled Tribes, TLT- Total Literates, MLT – Male Literates, FLT – Female Literates, TW- Total Workers, CLT – Cultivators, AL – Agril. Labourers
-
Important Links
-
About Department
-
How to Reach Us
Department of Sundarban Affairs
(Govt. of West Bengal)
Mayukh (3rd Floor), Salt Lake
Kolkata - 700091
Tel : +91-33-2334-9770 / 2359-8472
Fax : +91-33-2359-8472
Email : official.sunderbanaffairs@gmail.com
-
Sundarban Map
