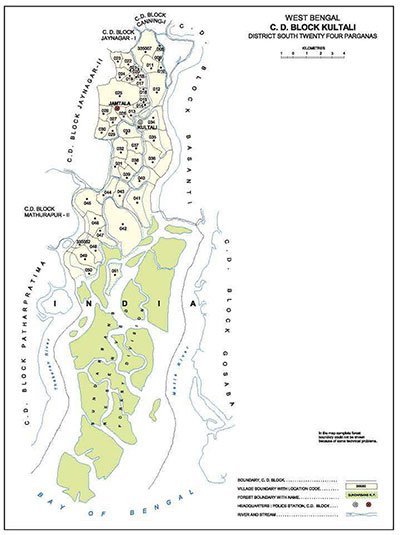
Home > South 24 Parganas > Block Profile > Baruipur (Sub-div) > Kultali
- Block Data
- Caste-wise Population
- Religion-wise Population
- Literacy Rate
- Sex Ratio
- Child Population
- Urban/Rural Population
- Working Population
Kultali Block of South Twenty Four Parganas district has total population of 229,053 as per the Census 2011. Out of which 117,562 are males while 111,491 are females. In 2011 there were total 45,099 families residing in Kultali Block. The Average Sex Ratio of Kultali Block is 948.
| Population | Literacy | Sex Ratio |
|---|---|---|
| 229,053 | 69.37% | 948 |
Kultali Block Data
As per the Population Census 2011 data, following are some quick facts about Kultali Block.
| Sl. No | Type | Total | Male | Female |
|---|---|---|---|---|
| 1 | Children (Age 0-6) | 35,727 | 18,074 | 17,653 |
| 2 | Literacy | 69.37% | 66.86% | 49.78% |
| 3 | Scheduled Caste | 104,193 | 53,940 | 50,253 |
| 4 | Scheduled Tribe | 5,672 | 2,902 | 2,770 |
| 5 | Illiterate | 94,952 | 38,961 | 55,991 |
Caste-wise Population - Kultali Block
Schedule Caste (SC) constitutes 45.5% while Schedule Tribe (ST) were 2.5% of total population in Kultali Block.
| Sl. No | Type | Total | Male | Female |
|---|---|---|---|---|
| 1 | Schedule Caste | 104,193 | 53,940 | 50,253 |
| 2 | Schedule Tribe | 5,672 | 2,902 | 2,770 |
Religion-wise Population - Kultali Block
| Sl. No | Religion | Total | Male | Female |
|---|---|---|---|---|
| 1 | Hindu | 159,897 (69.81%) | 82,803 | 77,094 |
| 2 | Muslim | 68,386 (29.86%) | 34,377 | 34,009 |
| 3 | Christian | 254 (0.11%) | 124 | 130 |
| 4 | Sikh | 23 (0.01%) | 10 | 13 |
| 5 | Buddhist | 18 (0.01%) | 10 | 8 |
| 6 | Jain | 15 (0.01%) | 9 | 6 |
| 7 | Other Religion | 138 (0.06%) | 66 | 72 |
| 8 | No Religion Specified | 322 (0.14%) | 163 | 159 |
Literacy Rate - Kultali Block
Average literacy rate of Kultali Block in 2011 were 69.37% in which, male and female literacy were 79.01% and 59.14% respectively. Total literate in Kultali Block were 134,101 of which male and female were 78,601 and 55,500 respectively.
Sex Ratio - Kultali Block
The Sex Ratio of Kultali Block is 948. Thus for every 1000 men there were 948 females in Kultali Block. Also as per Census 2011, the Child Sex Ratio was 977 which is greater than Average Sex Ratio ( 948 ) of Kultali Block.
Child Population - Kultali Block
According to Census 2011, there were 35,727 children between ages 0 to 6 years in Kultali Block. Out of which 35,727 were male while 35,727 were female.
Urban/Rural Population - Kultali Block
As per Census 2011, there are total 0 families under Kultali Block living in urban areas while 0 families are living within Rural areas. Thus around 0% of total population of Kultali Block lives in Urban areas while 100% lives under Rural areas. Population of children (0 - 6 years) in urban region is 0 while that in rural region is 35,727.
| Sl. No | Subject | Total | Urban | Rural |
|---|---|---|---|---|
| 1 | Population | 229,053 | 0 | 229,053 |
| 2 | Children (0 - 6 years) | 35,727 | 0 | 35,727 |
| 3 | Schedule Caste | 104,193 | 0 | 104,193 |
| 4 | Schedule Tribe | 5,672 | 0 | 5,672 |
| 5 | Literacy | 69.37% | 0% | 69.37% |
| 6 | Sex Ratio | 948 | 0% | 948 |
Working Population - Kultali Block
In Kultali Block out of total population, 87,670 were engaged in work activities. 55.9% of workers describe their work as Main Work (Employment or Earning more than 6 Months) while 44.1% were involved in Marginal activity providing livelihood for less than 6 months. of 87,670 workers engaged in Main Work, 13,838 were cultivators (owner or co-owner) while 19,102 were Agricultural labourer.
| Sl. No | Type | Total | Male | Female |
|---|---|---|---|---|
| 1 | Main Workers | 48,976 | 43,452 | 5,524 |
| 2 | Cultivators | 13,838 | 13,274 | 564 |
| 3 | Agriculture Labourer | 19,102 | 17,644 | 1,458 |
| 4 | Household Industries | 3,125 | 1,863 | 1,262 |
| 5 | Other Workers | 12,911 | 10,671 | 2,240 |
| 6 | Marginal Workers | 38,694 | 21,127 | 17,567 |
| 7 | Non Working | 141,383 | 52,983 | 88,400 |


